This blog was written before Pardot was renamed to Marketing Cloud Account Engagement. You can read more about the name change and what it means here.
What better time to discuss Pardot analytics than when we receive some great new features as part of the Winter release?
In this article, we will cover everything you need to know about using Pardot Analytics for reporting to the C-suite.
From how the B2B Marketing Analytics app works with Pardot, to useful tools, common terms, and great resources for understanding and interpreting Pardot analytics in line with your business objectives.
In the second half of the post, we’ll also run through some great analytics features in Salesforce’s new 2019 Winter Release.
Having been on both sides of the sales and the marketing fence during my career, I really enjoy digging into this topic!!
Using B2B Marketing Analytics for better reporting
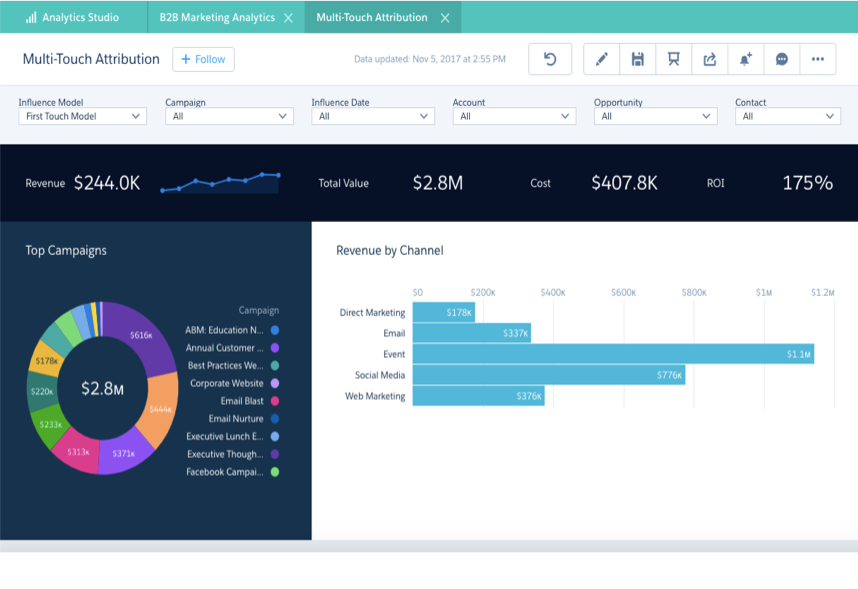
B2B Marketing Analytics is an Einstein Analytics app built for the B2B marketer.
It holds both Salesforce and Pardot data, made possible by your Salesforce connector.
The app consolidates marketing and sales data in one place, which we all know is absolutely essential for having true visibility of marketing and sales attribution.
Analytics provides customers with creative, versatile dashboards to instantly view and report on marketing and sales metrics, deliver insights to teams, and enable us to take data-driven actions to maximise marketing and sales efforts.
In short, it helps us to see the full sales cycle in one place and report on this to the C-suite.
Now that we know how the B2B Marketing Analytics app helps with our basic marketing reporting needs, let’s take a look at some of the tools we should expect to come across in this Salesforce and Pardot feature.

3 components you’ll find in the Pardot analytics app
B2B Marketing Analytics has 3 key components and each allows us to take different actions in our reporting processes. These are:
- Datasets
- Dashboards
- Lenses
Like Jenga without tumbling down, each of these components builds on the others.
Datasets
Datasets contain all source data which is formatted in a way that is easy to explore.
Lenses
The data from your datasets can be used to build Lenses.
Lenses are a particular view of a dataset’s data. Think of it like zooming into a specific area of data.
Dashboards
Lastly, dashboards are built from your lenses.
Dashboards are essentially a set of charts, metrics, and tables based on the data in one or more lenses.
Each of these components can be as customised as required to ensure that they fit the exact business goals your company is trying to achieve i.e. sales, revenue, profit, and so on.
The good news is, Pardot does have out-of-the-box and template Dashboards that you can use to get a head-start.
The Pardot B2B Marketing Analytics glossary
Part of getting to grips with the B2B Marketing Analytics app is understanding the language Salesforce uses to describe different elements.
For example, you may come across the term co-group’, which Salesforce defines as being
used to combine data from two or more data streams. The data streams can be joined using common fields.’
The good news is, you don’t need to Google every new analytics term you come across while delving into your Dashboards. You can simply bookmark this Tableau CRM Glossary (formerly Einstein Analytics).
Does everyone have access to B2B Marketing Analytics?
Actually, no.
There are a couple of factors that affect whether you can use B2B Marketing Analytics. The first is the type of Pardot edition that you have.
For those using Pardot Plus, the app is included. However, if you use Pardot Pro the app is an add-on so you will need to speak with your account manager about enabling this feature.
In short, B2B Marketing Analytics is:
available in: Pardot Plus and Advanced Editions. Available for an extra cost in Pardot Pro and Ultimate Editions.’
Secondly, there are prerequisites, such as whether you are using Connected Campaigns, which you can read about here.
Resources to get started with B2B Marketing Analytics
If you’re not already using the B2B Marketing Analytics app, the first thing you’ll want to do is tell your marketing and sales teams that all of their data can now be held in one single place and that this will ultimately lead to more informed, data-driven decisions about both marketing and sales activity.
I’m sure it will be music to their ears!
Next, you’ll want to get started by watching a visual demo video, before proceeding to implement the app in line with best practice.
This isn’t an overly complex process and Salesforce has provided a bunch of resources to help you get set up and using this Pardot analytics feature quickly.
You can find all of the Pardot training for B2B Marketing Analytics at this link.
Plus, view the guidelines based on your Pardot edition here.
There’s no denying that analytics is a growing focus for Pardot and Salesforce users combined and in answer to this, users now have better Pardot analytics capabilities, thanks to a series of 2019 winter releases.
2019 Winter Release Features for Better Pardot analytics
The first release I’m particularly excited about is found in the B2B Marketing Analytics app.
Explore Combined Prospect and Activity Data in B2B Marketing Analytics.
This great new feature is all about digging deeper into our prospects and their engagement.
It has set out to encourage us to add the prospects and activity’ Dataset to our Lenses, which will ultimately help us further understand our prospects and develop marketing and sales approaches that resonate.
The dataset includes three years' worth of engagement information, tied to both the default and custom prospect fields in the Pardot Prospect dataset! In Layman’s terms, this feature allows us to identify our most valuable prospects without any heavy reporting workload or customizations.
It’s simple, yet effective.
If this seems like something that your business would find useful, here is how you set it up!
Dig into Account Records with Engagement History Dashboards
Secondly, we have the ability to give sales and marketing users the power to explore all of your data and manipulate it accordingly by adding Engagement History Dashboards to a tab on account records.
Via the use of account dashboards together with dashboards on campaign records you will now see a clearer and bigger picture of your prospect engagement.
So, to recap, not only is the B2B Marketing Analytics app one you most definitely should use to unite sales and marketing data in a single place, but you also have access to enhanced analytics features in Pardot.
All of which can be the difference between a data-driven marketing strategy that generates and converts more leads, and an assumed marketing strategy that loses the interest of potential customers.
If you are feeling inspired by the idea of improving your use of Pardot analytics, or have questions about any of the covered content in this post, please reach out!

