If you’ve been using the pre-built dashboards in the Tableau CRM Analytics Studio B2BMA app, and feel you aren’t getting insights into your data that you desire, it may be time to build your own custom B2BMA dashboards.
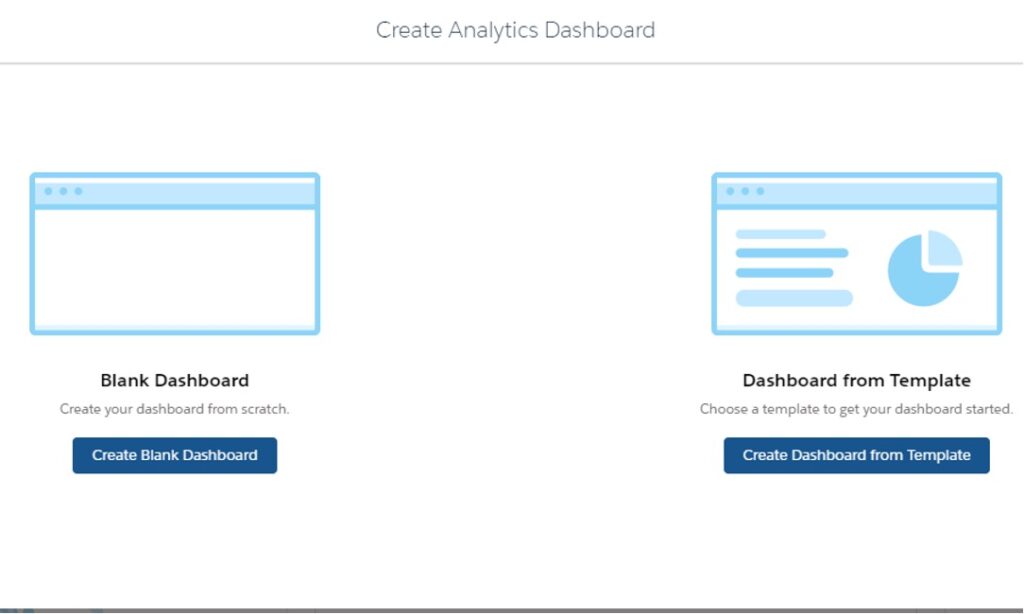
When it comes to creating a dashboard we have two options, we can either use one of the pre-built templates provided in the B2BMA app or create a dashboard on a blank canvas. I always recommend creating a dashboard on a blank canvas, as the templates can limit what your data is based on.
However, before diving in and creating your dashboard, I recommend being familiar with our best practice tips first.

Top 10 Best Practices
1. Map and plan first!
I always recommend taking the time to plan out what data you want to see, how you’d like the dashboard to look and the design, prior to creating. By knowing what data you want to be visible in the report, you can see if this data exists in Pardot and Salesforce. For example, if you want to know which campaign has led to the highest conversions, it’s best to check your assets have been associated with the correct campaigns in Pardot first!
Once you have the data organised, think about how this data is to be displayed. Are you going to be using bar graphs? Or tables? Is this data going to be overwhelming for your users or will they be able to easily navigate through the dashboard?
2. Choose the correct chart types
Following on from tip one, when designing your dashboard it’s important to base it on the characteristics of the data, not solely the look. When you create a new query, use the Suggested Charts’ for hints. Whilst a doughnut chart might be more visually appealing, have you got 500 different values? This will make it harder for the viewer to drill into the chart for more valuable data.
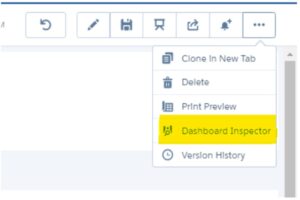
3. Use the Dashboard Inspector
This feature is available on custom dashboards and checks the performance of the dashboard. It allows us to look into each step and get a better understanding of what is happening, which is key if you are noticing errors across lenses or queries.
Additionally, it will give you suggestions on how to improve the dashboards if it’s been noticed that your dashboard is running slow by using the Run Performance Check’.
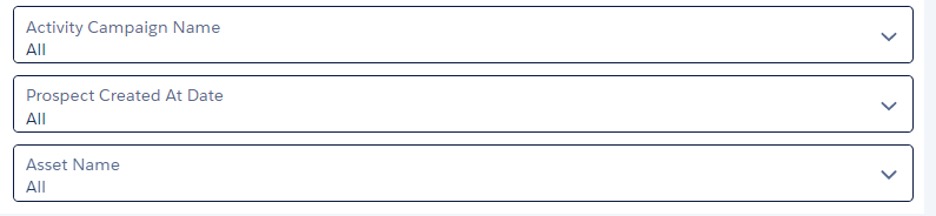
4. Use Global Filters for interactivity
If there is a global filter on the dashboard such as Created at Date’ the dataset is filtered first prior to it running. This prevents the time it takes for the data to display as the query is run against a smaller dataset. This is key if your dashboard displays all data such as Prospect Full name’.
5. Group filters together
It’s easier for users if filters are grouped together and are at the top of the dashboard so that they are noticeable! I recommend using the container widget to help to section the filters away from the rest of the dashboard.
6. Use Containers
Following on from step four, it is useful to use the container widgets to frame and organise related elements in the dashboard.
7. Set the Dashboard properties
The Dashboard properties include setting the default widget properties, background colour and border width. If you know you want a specific background colour, text size or number size across your queries this will make creation much quicker!
8. Apply titles and labels to sections and charts
Use titles and subtitles to provide a short explanation of what a specific query represents and how it should be used. Think about your users. Whilst you may know the dashboard inside out and what the dataset shows, they may not.
9. Add a description when edits are made
Hopefully, this is a best practice you already do when creating and editing a Pardot Engagement Studio, but every time you save the dashboard, it is really important to enter a brief description in the Version History field. This will help you remember what changes have been made to the dashboard.
10. Enable Open Salesforce Records in New Browser Tabs’
Whilst this feature isn’t just for custom dashboards (the setting applies to dashboards in the Analytics Studio and dashboards embedded in Salesforce pages), I highly recommend enabling it if you haven’t already. It allows the viewer of the dashboard to select a Salesforce record action in the dashboard and opens the record in a new Lightning tab.
With all of these best practices in mind, you can go ahead and set up your custom B2B MA analytics dashboards! If you have questions along the way or need some support with planning your dashboards, we offer personalised and proactive Salesforce consulting.